Cascading Failures in Power Systems
Contact: Dr. Blazhe Gjorgiev
The reliability of electric transmission systems is challenged by the recent deployment of intermittent energy sources and market developments, which have resulted in a large amount of power volumes being transmitted over long distance and higher uncertainty in the system operation. Wide-area blackouts and cascading events in the past decades suggest that the system is operating with reduced safety margins.
Our research on cascading failures in power systems focuses on the development and validation of cascading failure analysis models, risk assessment and mitigation of cascading failures.
Cascades Platform
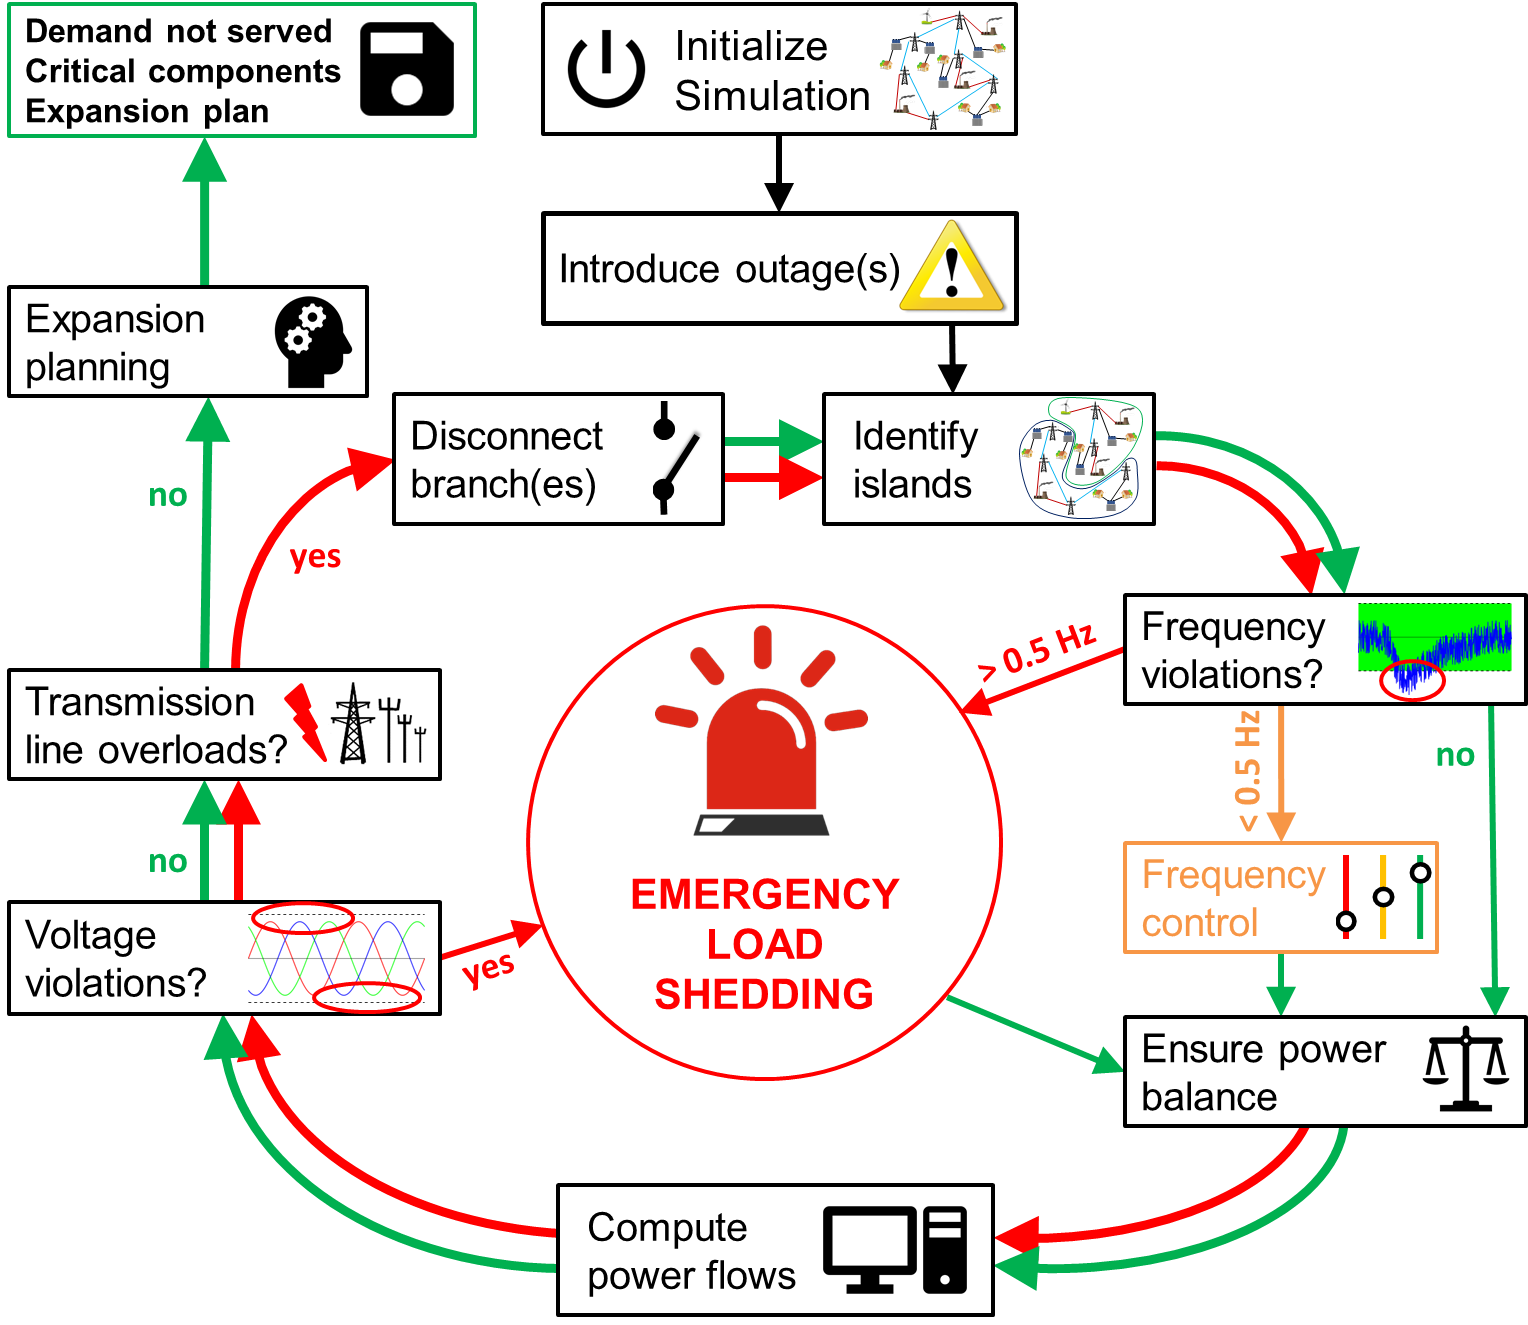
Cascades provides a platform for power system risk analyses and expansion planning. The objectives of Cascades are to perform: (I) cascading failure simulations; and (II) vulnerability analyses (III) risk-informed transmission system expansion planning. Cascades comprise two core models for cascading failure analyses, i.e., DC and AC based. Furthermore, the cascading failure models can be used on single or multi-zonal large power systems. Moreover, the cascading failure simulations are validated/calibrated using historical blackout data. The Cascades module comprises of four integral parts:
- A cascading failure simulations models (AC and DC);
- Vulnerability analyses method;
- Transmission system expansion planning method;
- Method for calibration of the cascading failure models.
Related Publications
Download Platform Description (PDF, 2.3 MB)Power System Vulnerability Analyses
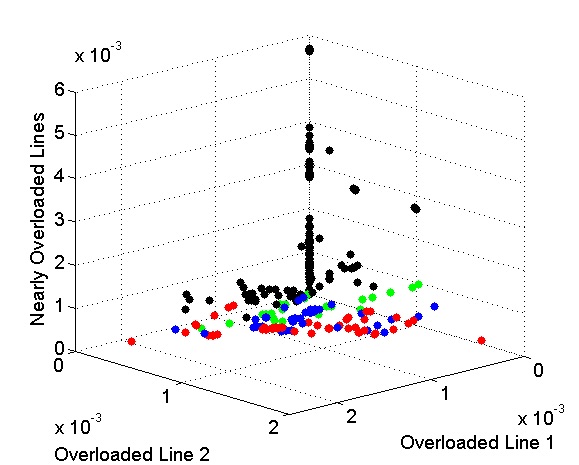
Power systems as critical infrastructure are an integral part of human society and are therefore of paramount importance to modern life. Vulnerabilities in the system, that are revealed either by accidental or deliberate events, can cause large losses of power supply with sever social and economic consequences. A tool that identifies the vulnerabilities in a power system can provide the operators the means to support reliable power system operations.
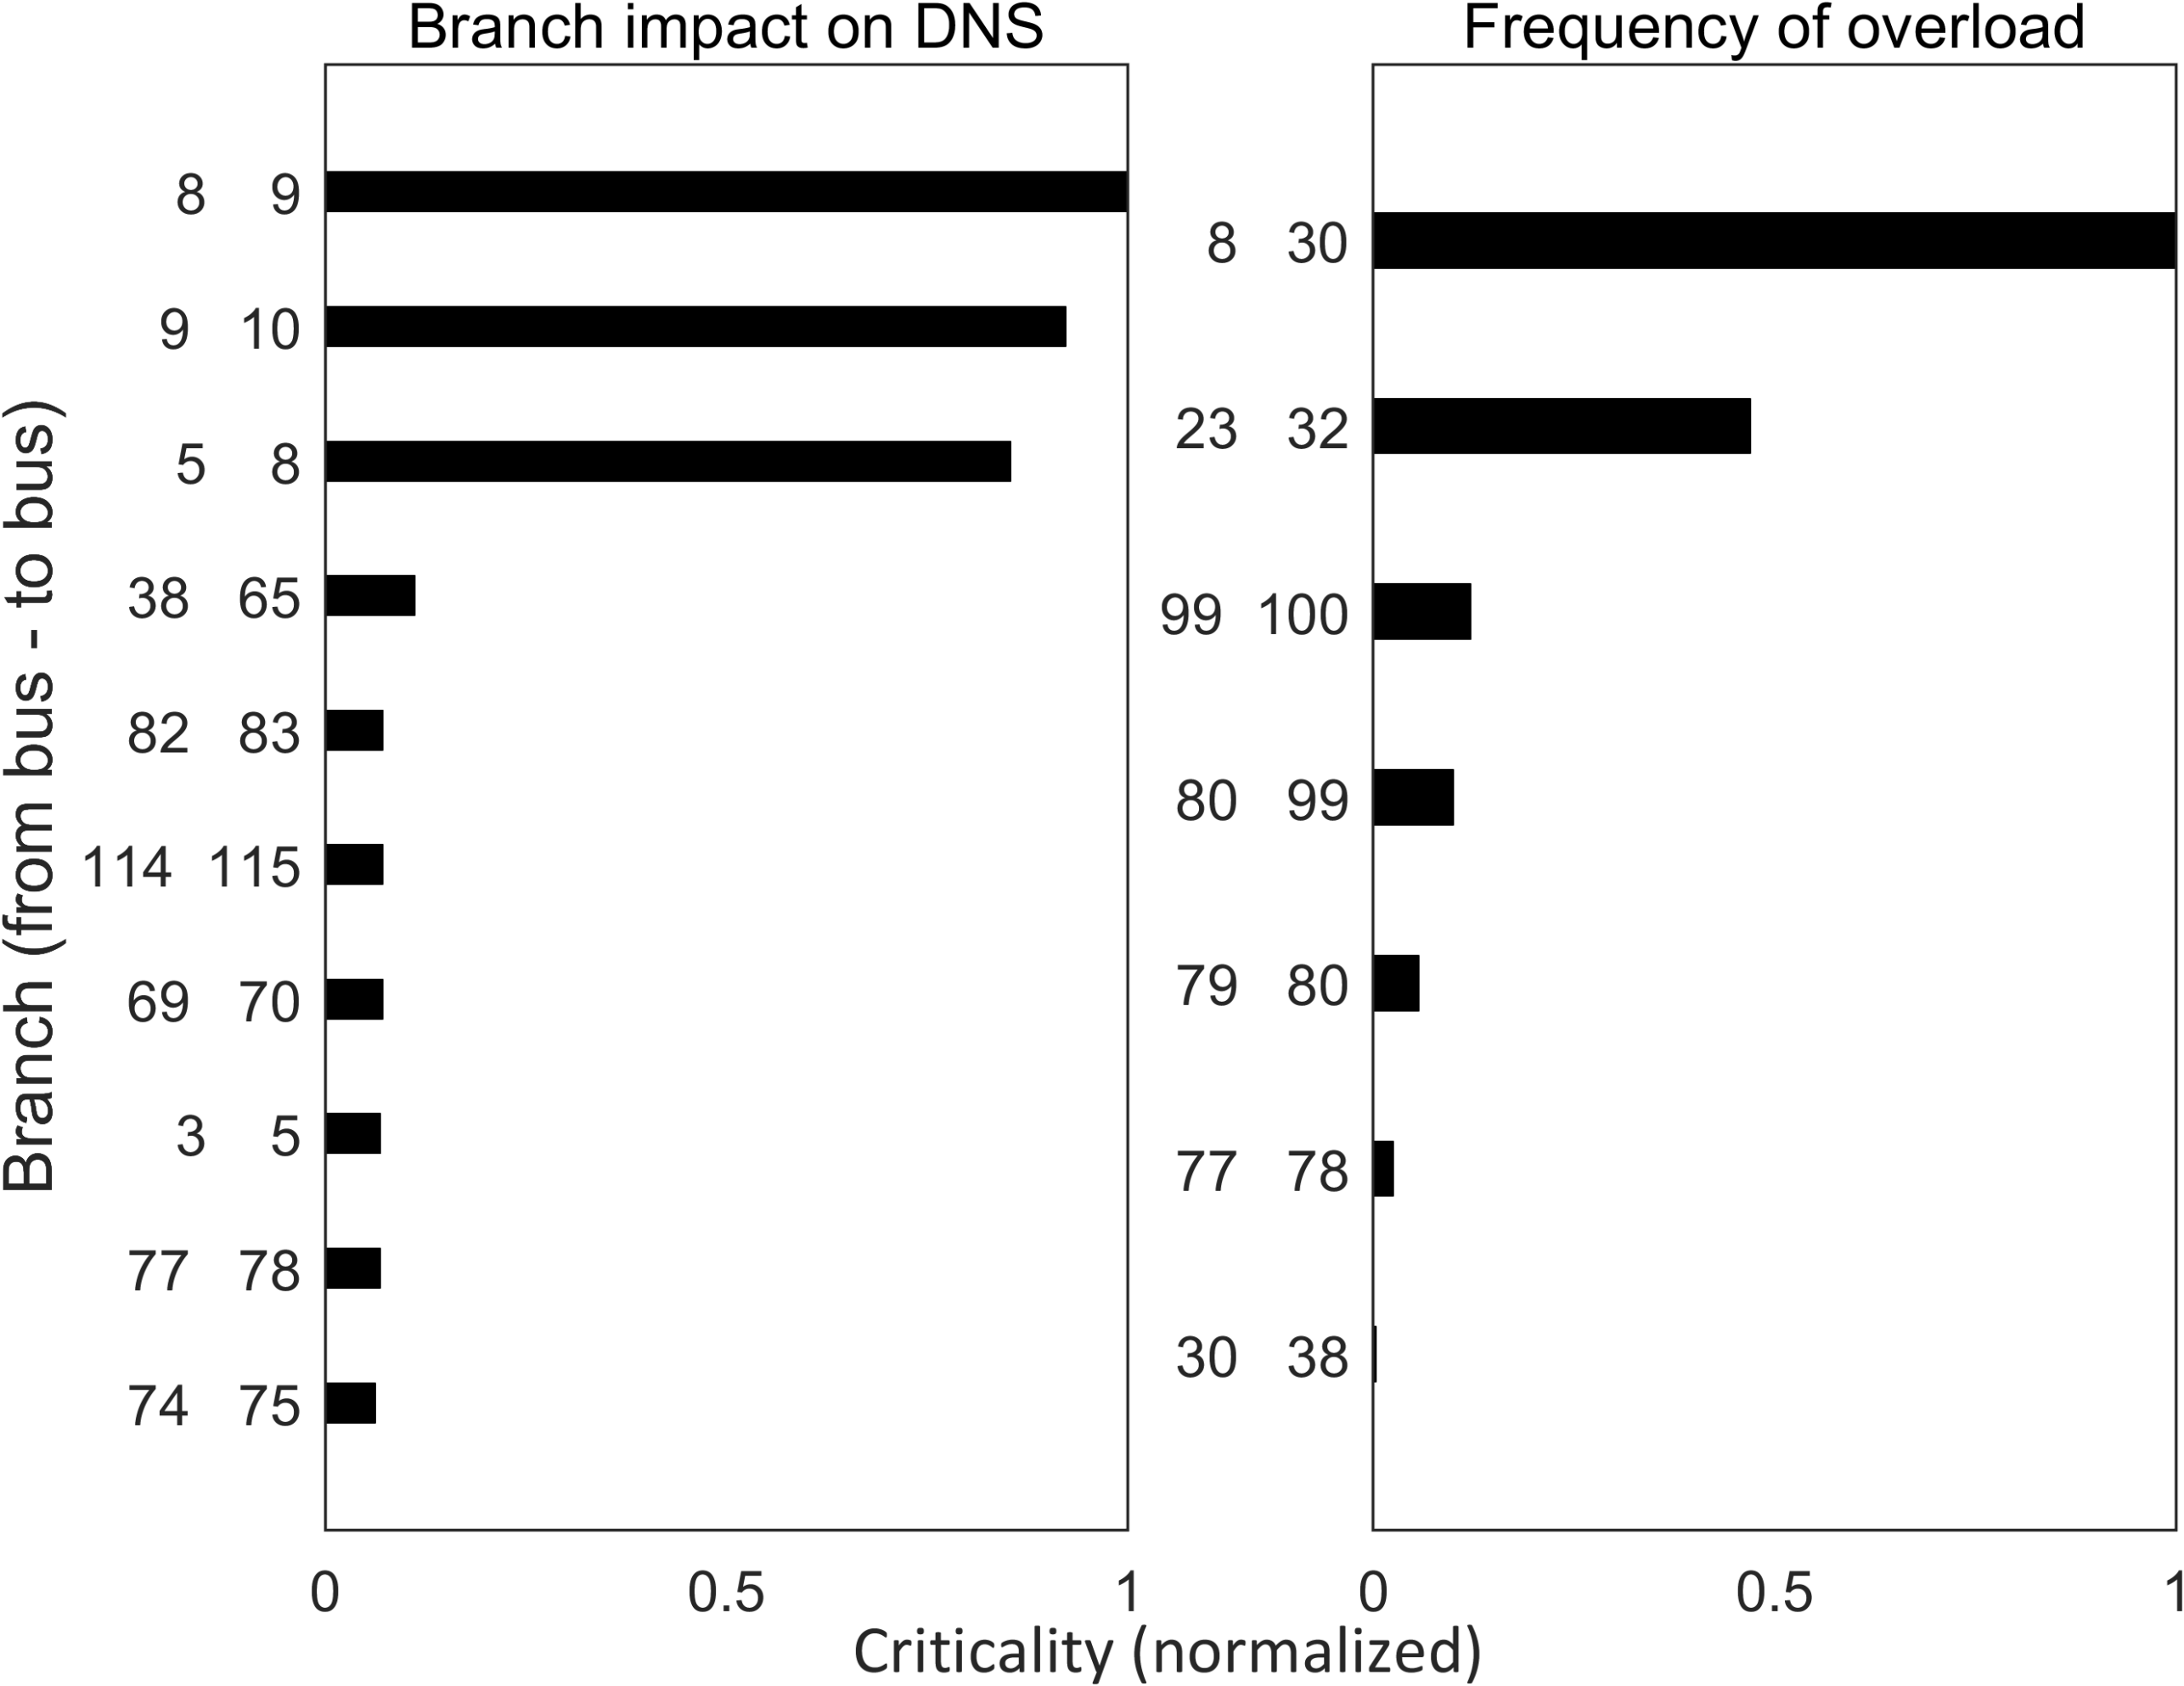
We have developed a methodology for power system vulnerability assessment that couples an AC based cascading failure simulation model and a meta-heuristic optimization procedure. The objectives of the assessment is to (1) rank the most important branches in the transmission grid, and (2) identify sets of branches if simultaneously tripped will cause the cascade with highest intensity. The first objective is achieved by ranking the criticality of the branches using two criteria (i) the impact that each branch failure has on the DNS and (ii) the frequency of line overload. The second objective is achieved by hard linking an AC based cascading failure simulation model and a meta-heurist based optimization procedure. The methodology allows the generation and the identification of vulnerability scenarios, and therefore, provides insights that can be used by operators in developing strategies to minimize the effects of accidental and deliberate events. The algorithm developed for the purpose of this study is applied to the IEEE 118-bus test system.
Risk-Informed Transmission System Expansion Planning
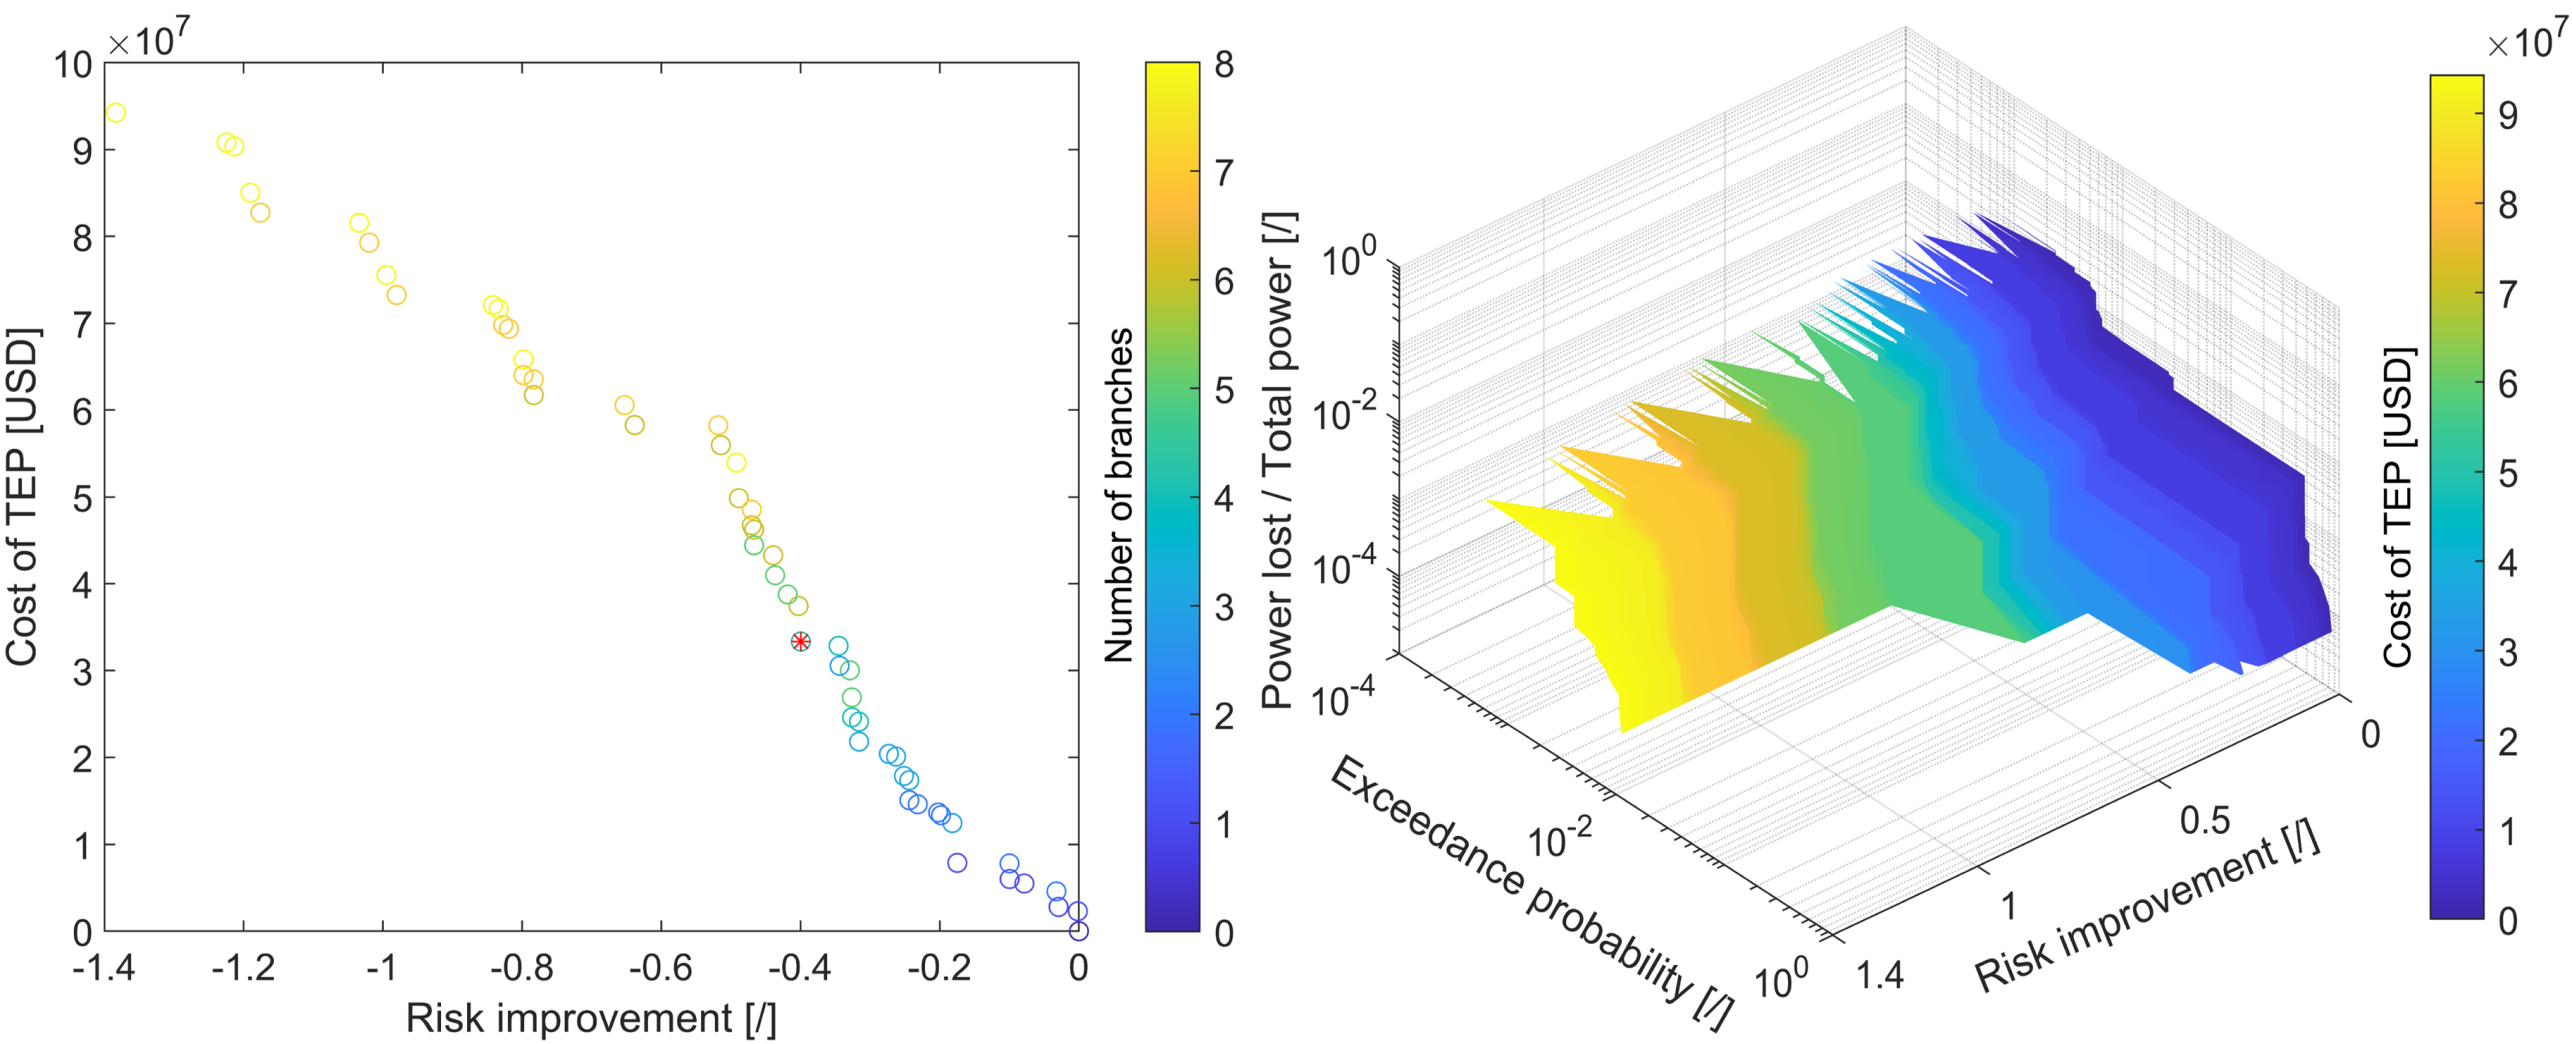
Latest standards for transmission system planning require investigation of the performance during the simultaneous loss of two elements and an assessment of the risk of cascading outages. Therefore, in-depth security analyses must be an integral part of system expansion. In this study, we propose a risk-informed transmission expansion planning method. At the core of the method is an AC based cascading failure model that simulates the power system responses after contingencies. The method aims to provide an optimal expansion plan striking the balance between the cost of expansion and the risk of systemic failures. Addressing this challenge requires a simulation based multi-objective optimization, which we tackle using a meta-heuristic algorithm. The tool developed for transmission expansion planning is applied to the IEEE 118-bus system and compared with state-of-the-art transmission expansion approaches. Remarkably, the proposed TEP procedure produces solutions that improve system security at comparable expansion costs.
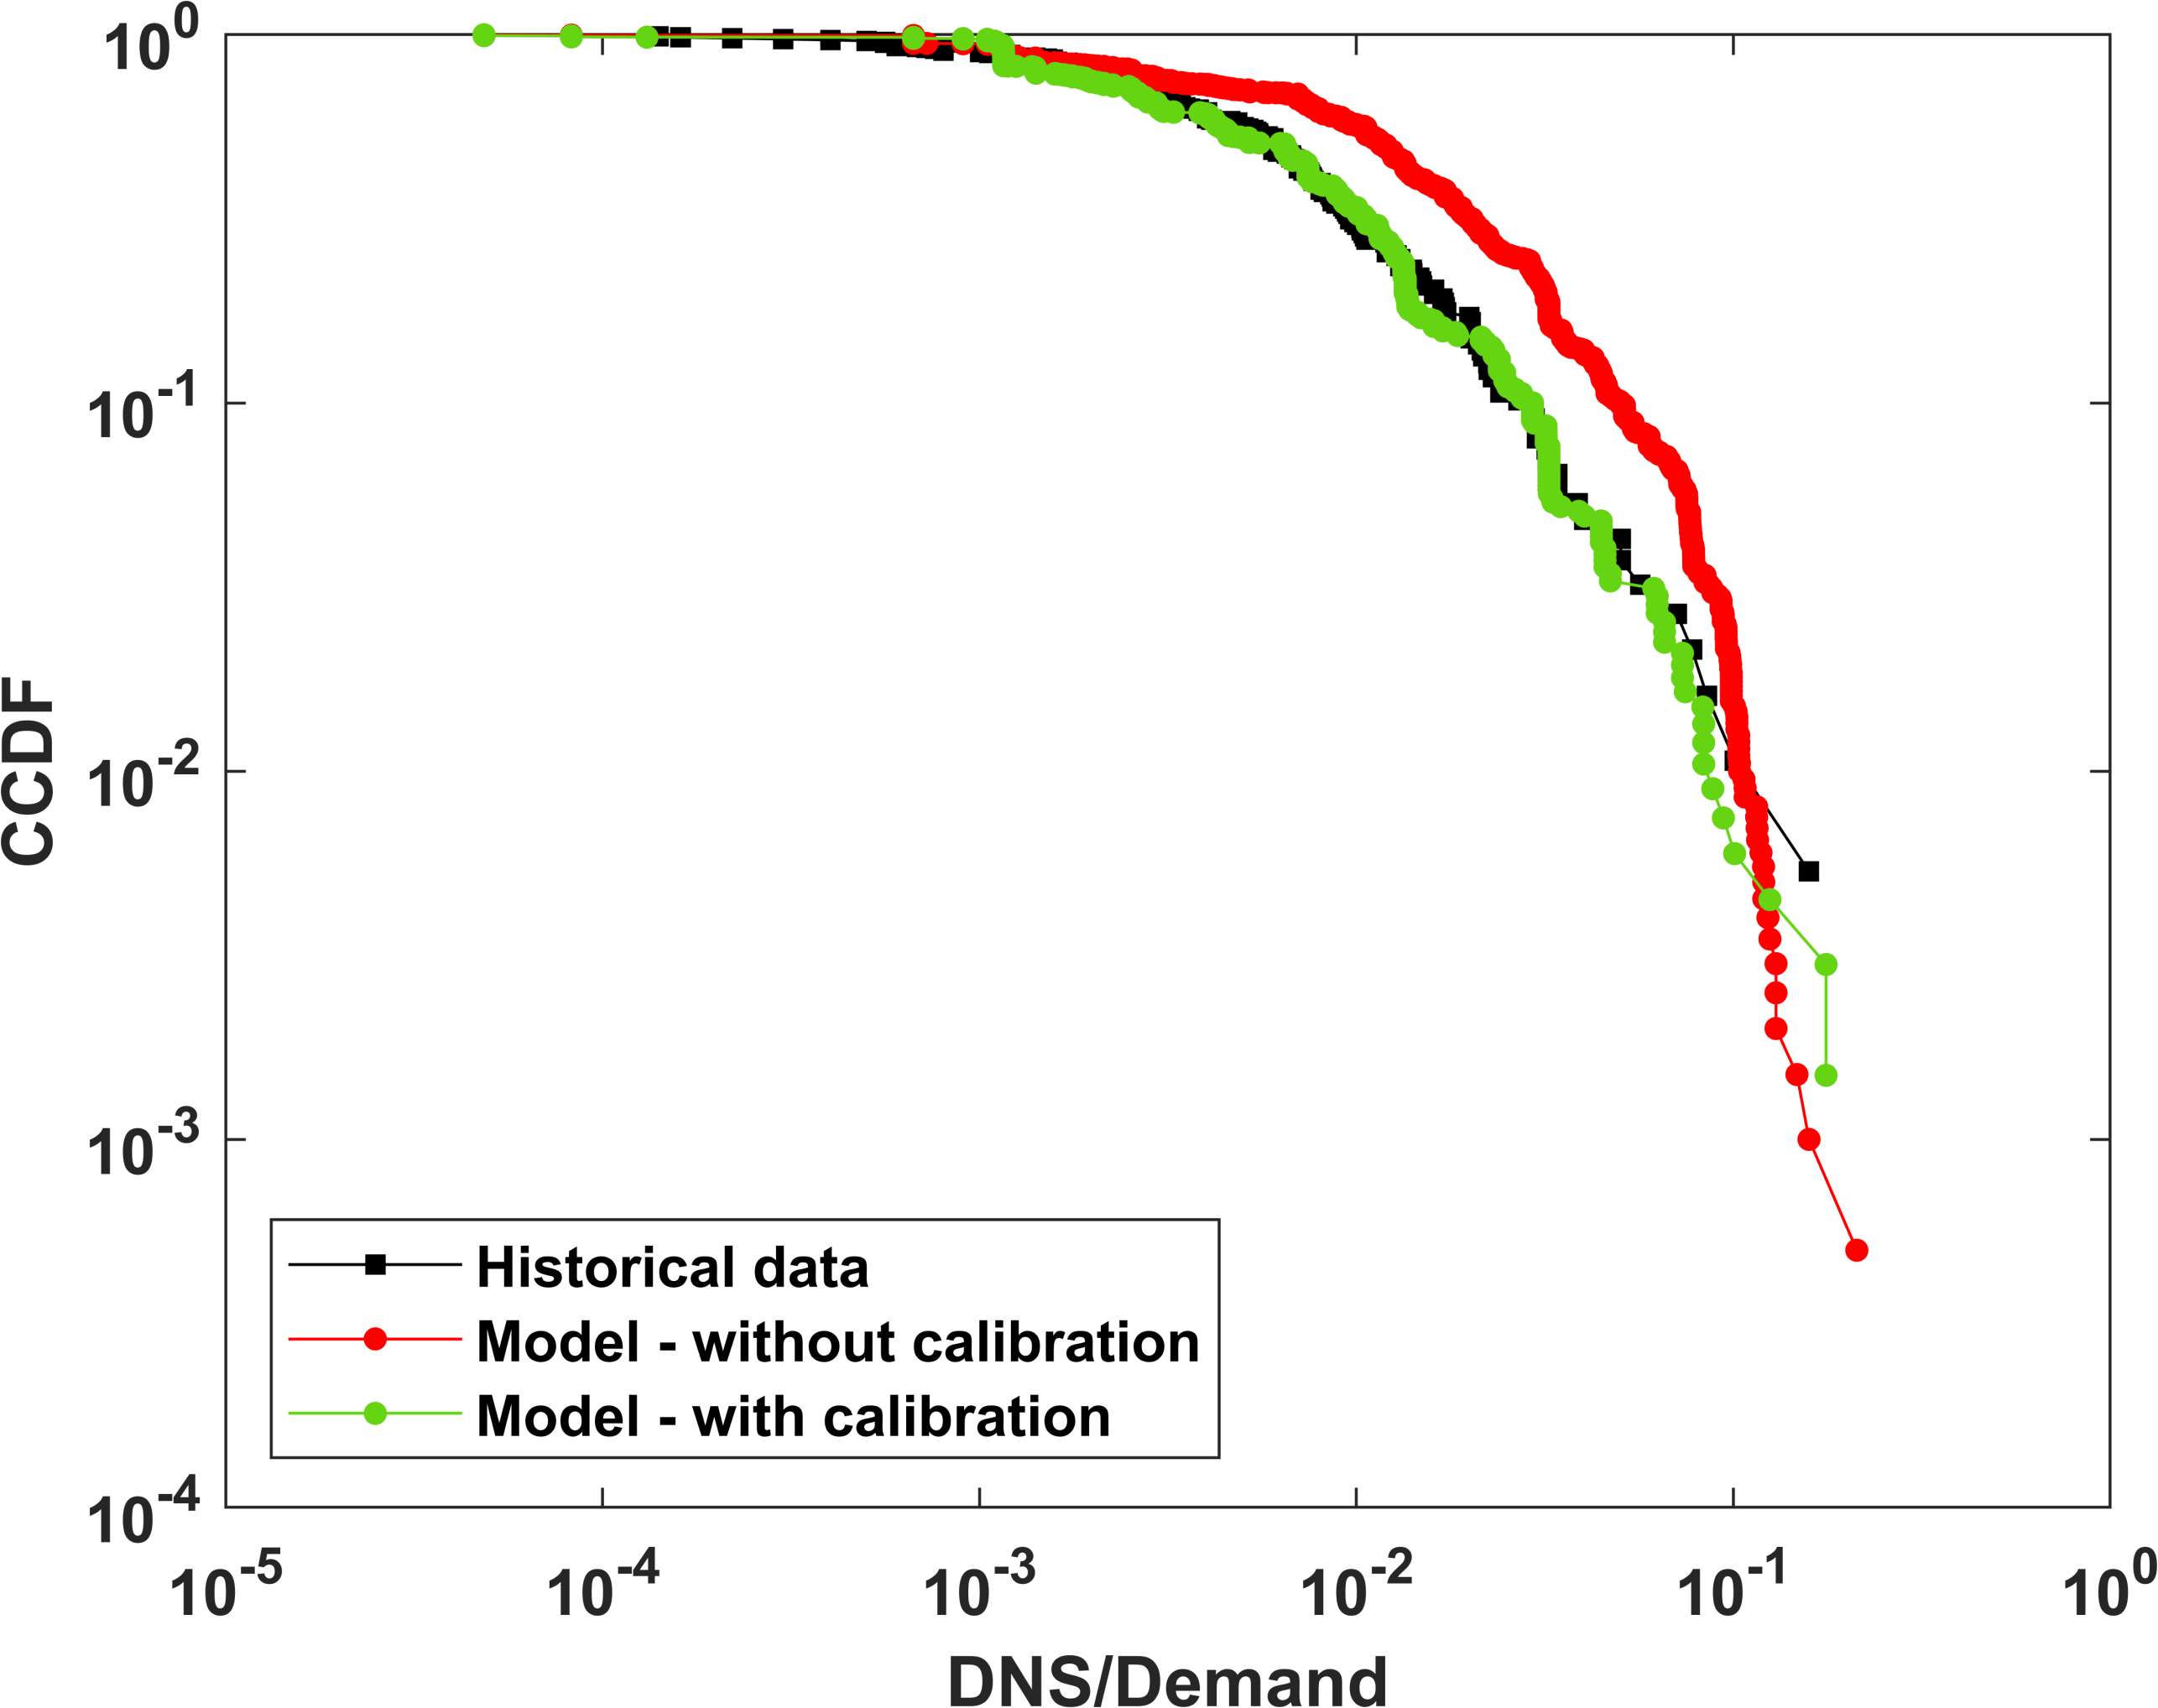
Validation of Cascading Failure Analysis
One of the most important results of the RRE’s cascading failure model is the risk curve, which represents the complementary cumulative distribution function (CCDF), or exceedance probability of the DNS. The risk curve serves as an indicator for the risk of systemic failures in the electrical power grid. To gain trust in our cascading failure model we have perform model validation as well as model calibration. We have used the reduced 240-bus Western Electricity Coordinating Council (WECC) network and historical blackout data provided by the North American Electrical Reliability Council (NERC). To calibrate the model we have resorted to algorithms equipped to solve simulation based optimization problems, including Genetic Algorithm, Meshed Adaptive Direct search, and Pattern Search – Particle Swarm Optimization. In general, by calibrating the line ratings we have obtained a good alignment between the simulated risk curve and the historical risk curve.
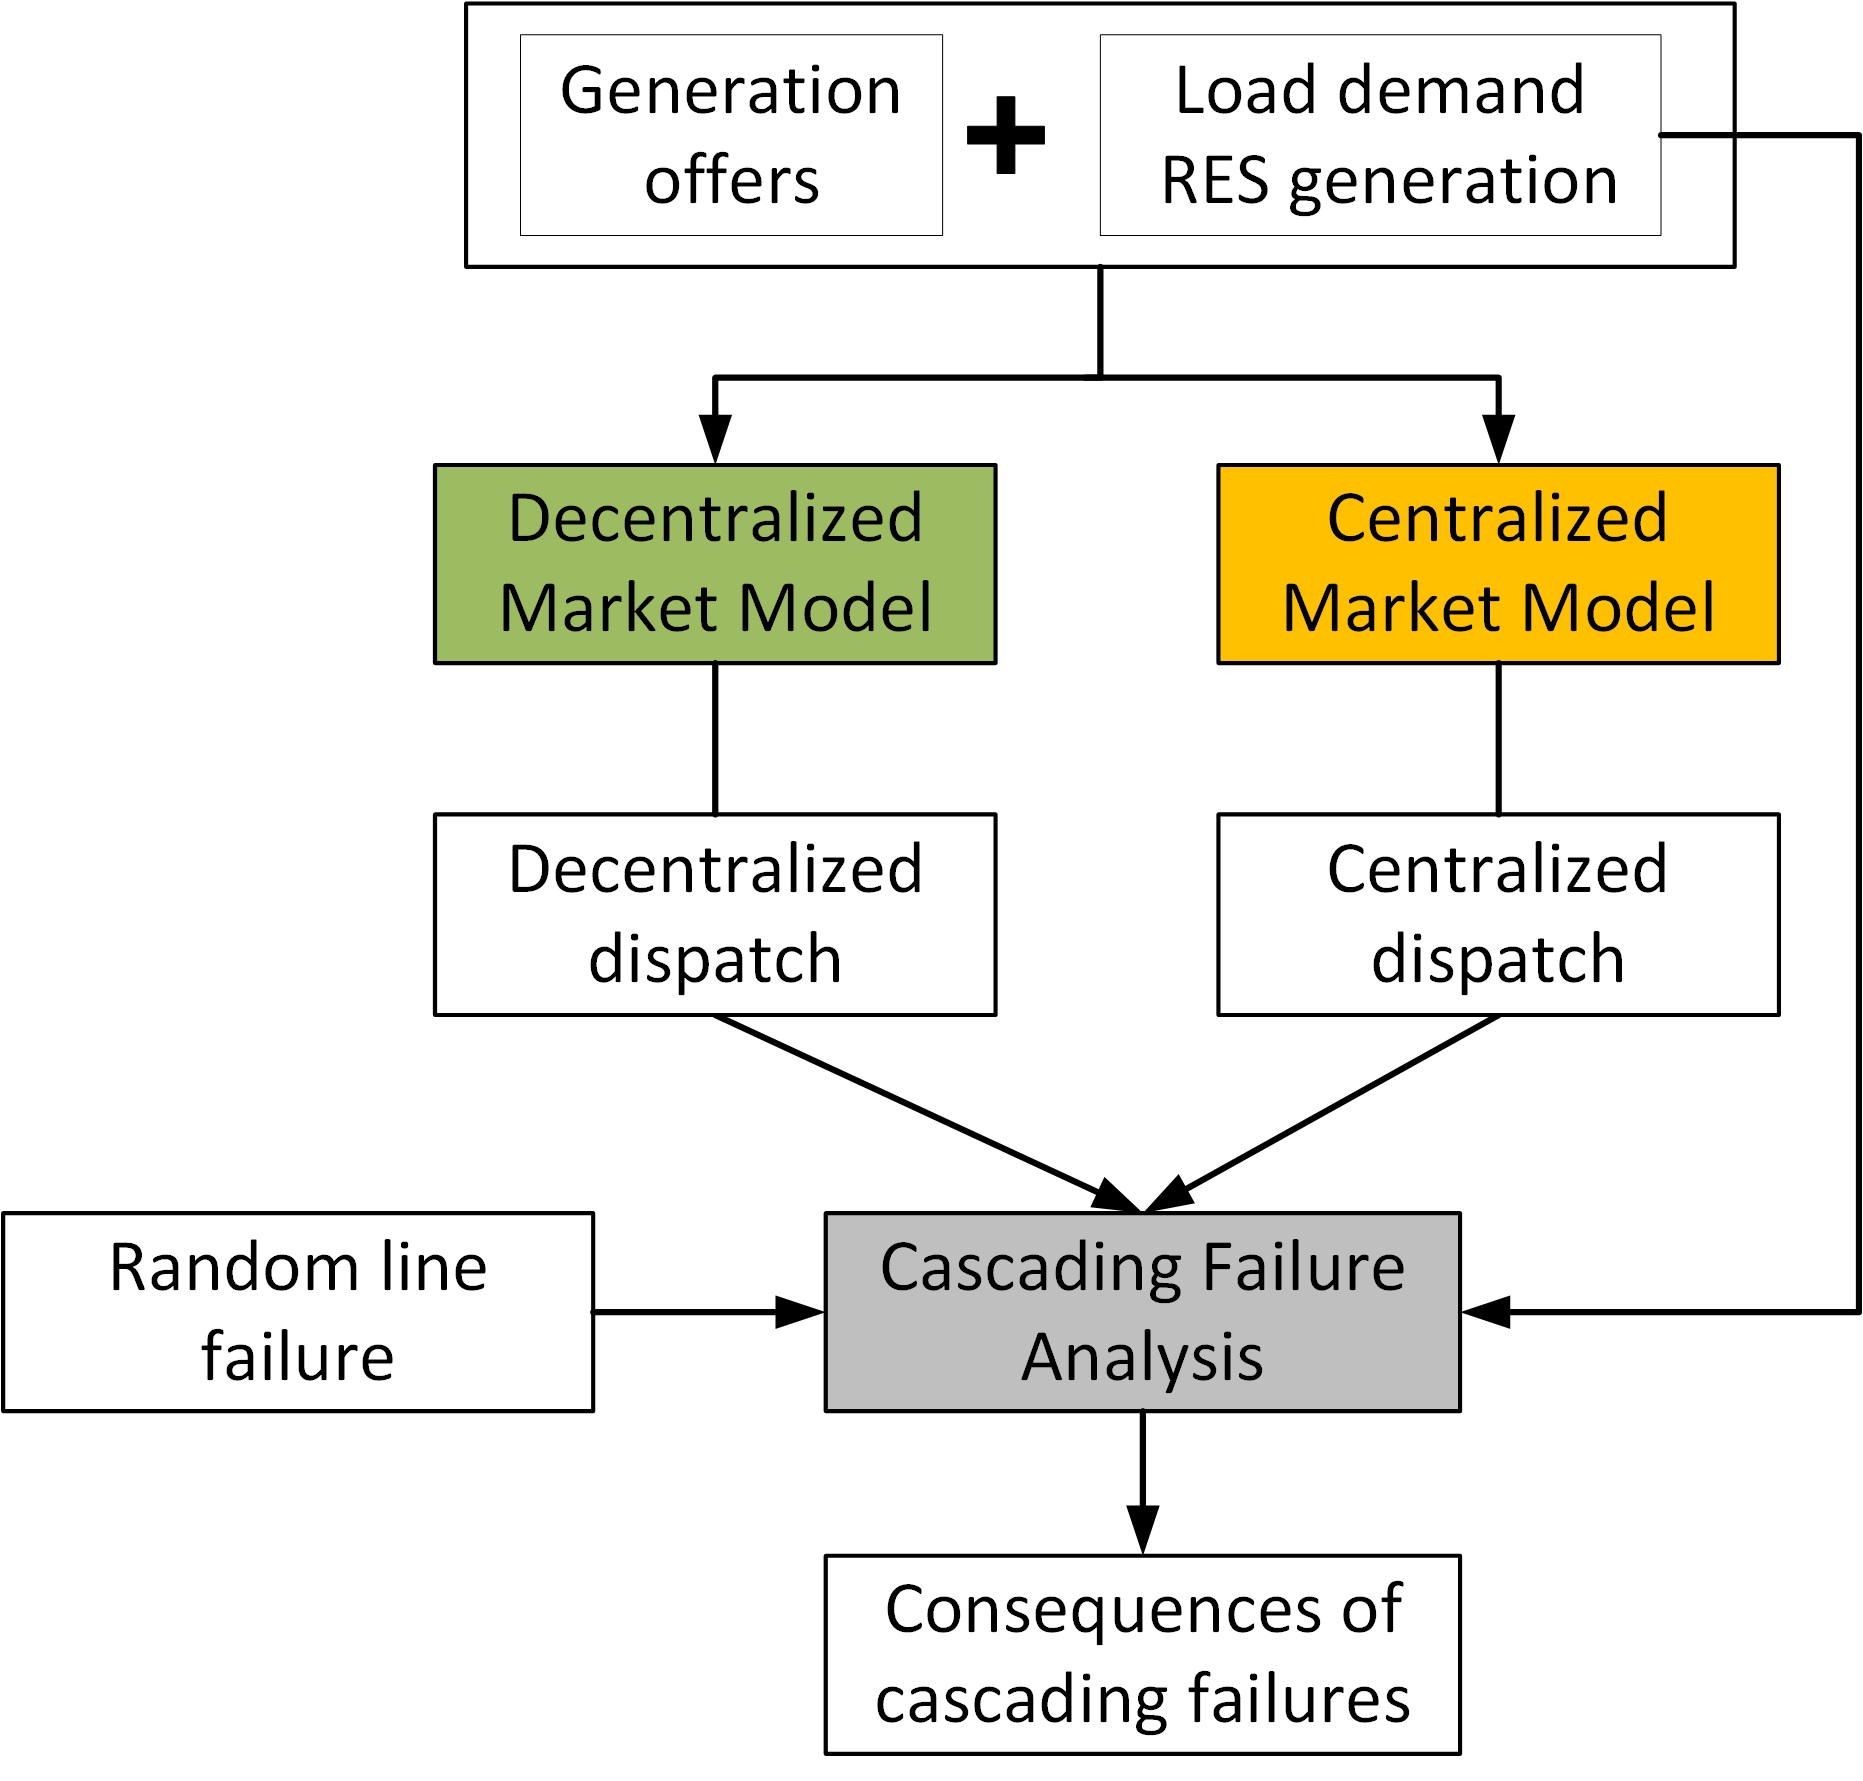
Energy Markets Impact on the Risk of Cascading Failures in Power Systems
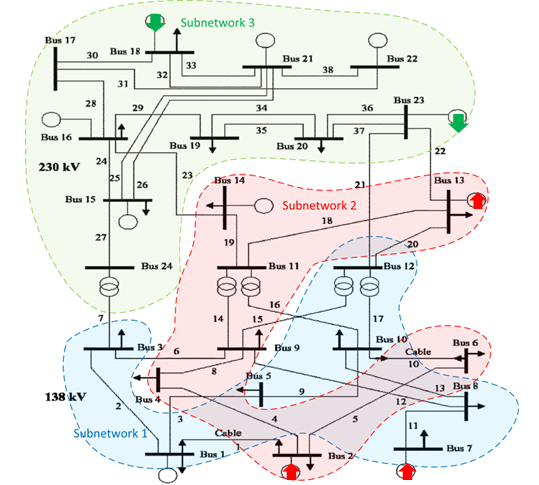
Wide-area cascading events happened suggest that the power system is operating with reduced safety margins. The generation dispatches provided by current energy markets may influence the risk of cascading outages. This paper aims at estimating the risk of cascading outages associated with diverse dispatch solutions by integrating market-based power dispatch models and a cascading failure analysis. Two alternatives of the pool-based market-clearing model are considered: the decentralized dispatch and the centralized dispatch. The risk of cascading outages stemming from diverse dispatches is estimated by the cascading failure analysis. Computational experiments are performed on the Swiss transmission network to assess cascading outages for the decentralized and centralized dispatches under diverse load conditions. The results provide insights on how the interplay between the market structures and the physical infrastructure impact the risk of cascading outages and can be a reference to facilitate infrastructure operators’ and policy makers’ decision making during transitions in electricity markets.
Effective Multi-objective Selection of Inter-subnetwork Power Shifts to Mitigate Cascading Failures
This project aims at developing a heuristic decision support system for alleviating line overloads and mitigating the consequences of cascading events. A graph-partitioning algorithm is developed to identify the subnetworks for which the overloaded lines act as power gates. Inter-subnetwork power shifts by generation rescheduling and, possibly, load shedding are applied to relieve the overloaded lines which bridge these subnetworks. The power shifts are selected based on their potential to simultaneously reduce overloads and prevent new ones. This multi-objective decision making is based on the sensitivities of the overloaded lines with respect to power shifts and on the time required to complete them. Line overloads are eliminated by guiding the formation of self-sufficient subnetworks.
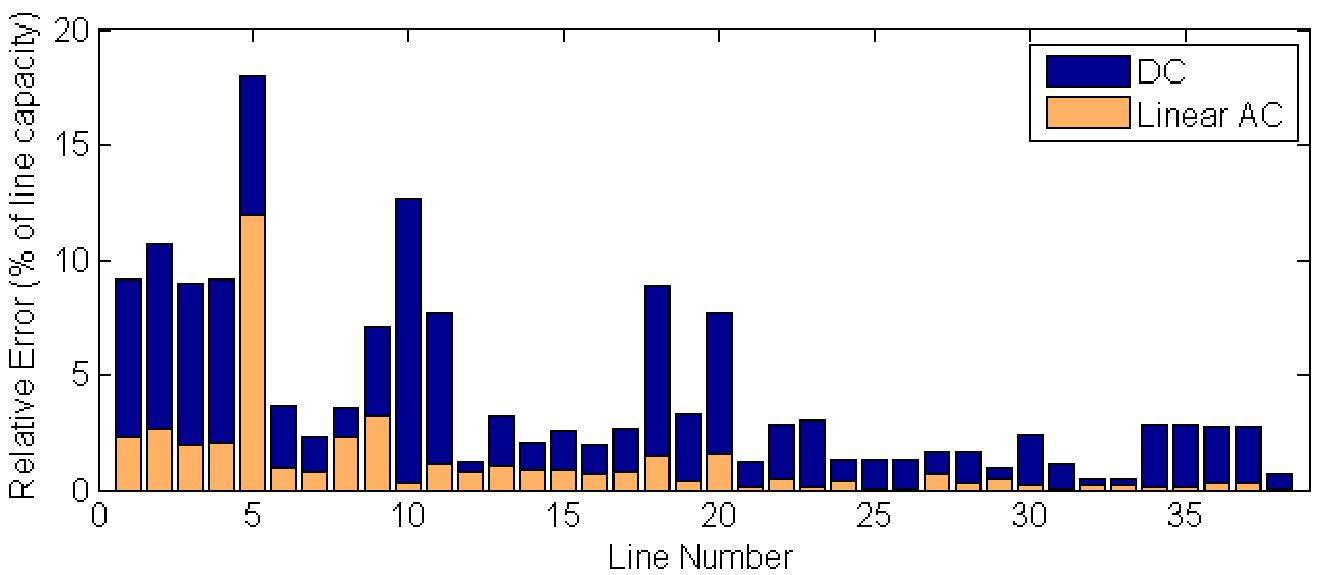
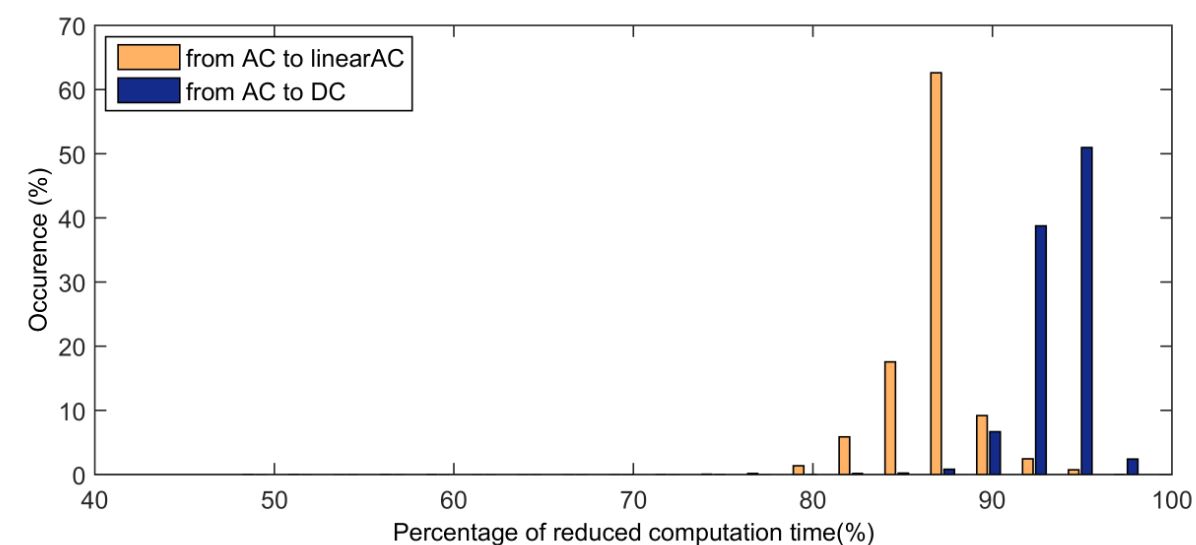
Linear Implicit AC PF Cascading Failure Analysis with Power System Operations and Automation
This project aims at developing a cascading outages model which captures power system operations, protections, automatic regulations, and remedial action schemes. It is based on linear implicit AC PF, which provides a tradeoff between computationally expensive AC PF and approximate DC PF. Combinations of several types of failures and interactions in blackouts are represented, i.e., cascading line overloads, large frequency deviation, reactive power problems and voltage drop.
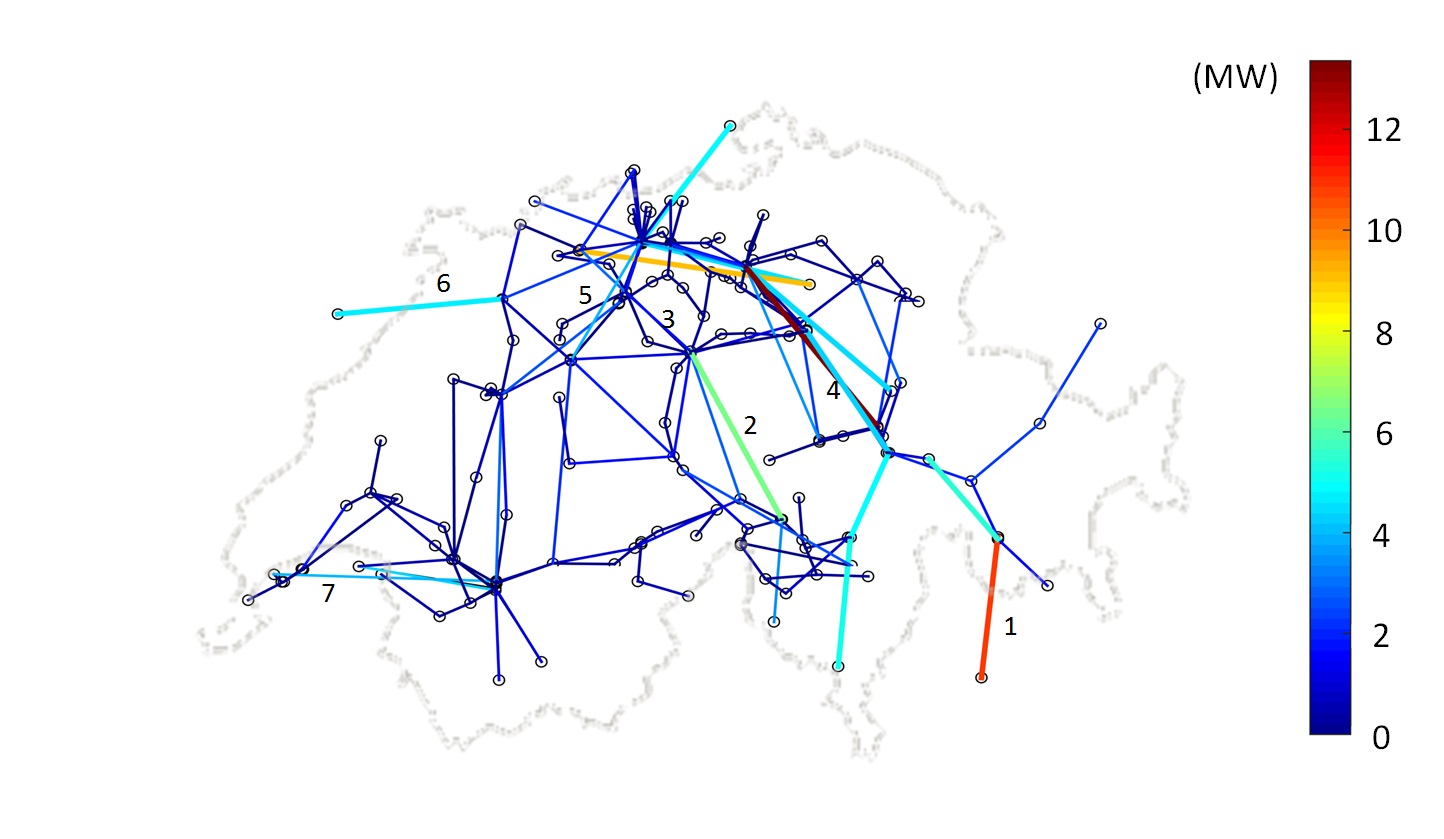
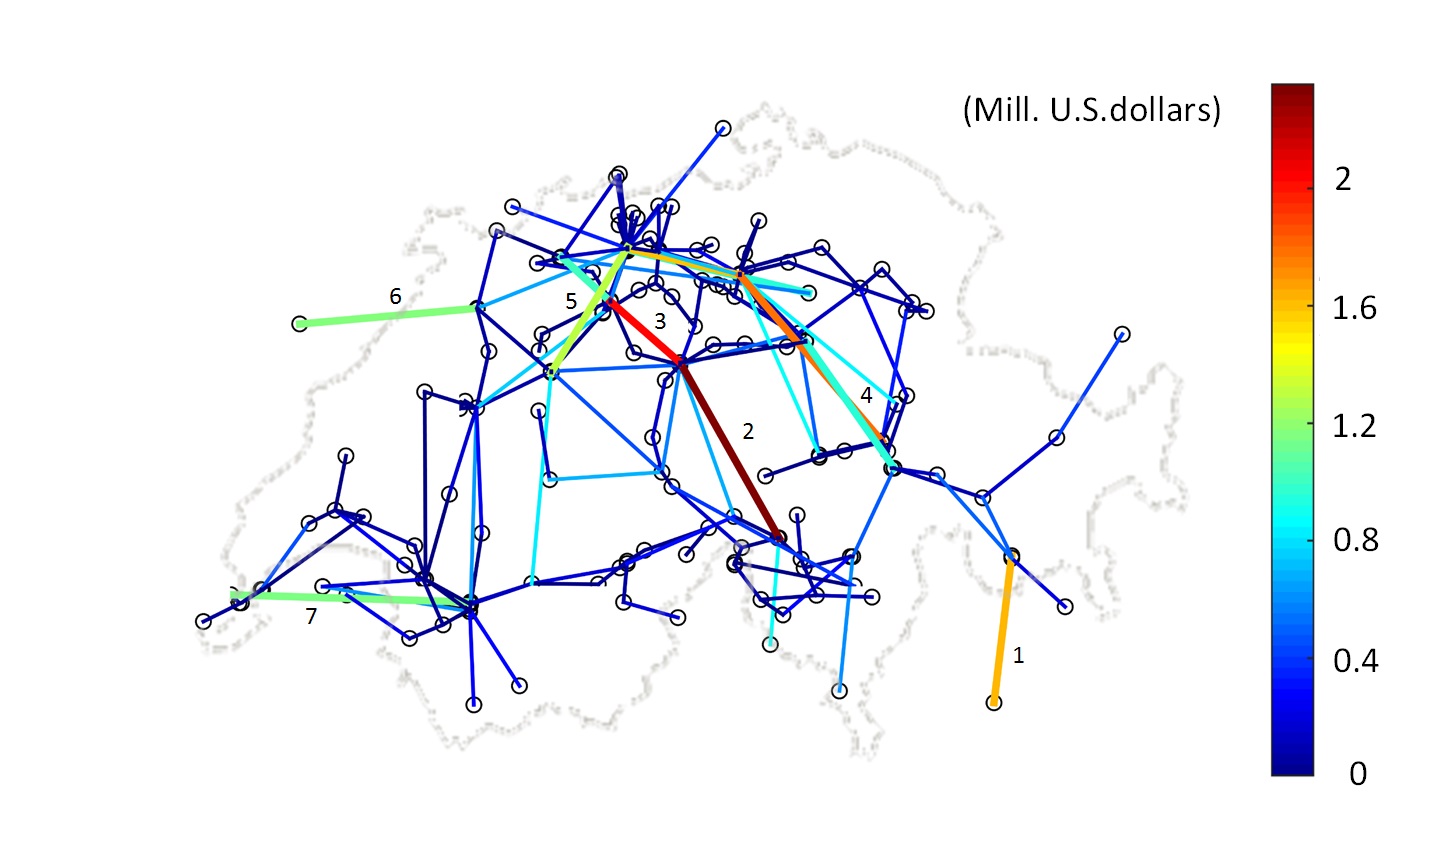
Measuring Community and Multi-industry Impacts of Cascading Failures in Power Systems
Many economic activities strongly depend on critical infrastructure systems, especially the electric power system. Failures in the electric power infrastructure not only cause the disruption of power supply but also result in losses in productivity across other dependent industries. This work aims to develop a framework that uniquely integrates a DC flow-based cascading failure analysis for the electric network with a multi-regional, multi-industry interdependency model to quantify the short-term economic impacts of electric power disruption due to cascading failures. A DC power flow-based cascading failure analysis is developed to enable the accurate reproduction and consequences estimation of a cascading event. We use the economic interdependency model to evaluate the economic impact of a cascading event taking into account spatial explicitness and cross border effects. The economic impacts due to both the direct power supply disruption and the workforce unavailability are estimated. A case study was conducted on the Swiss electric network, accounting for the international impact on other related countries. The results provide guidance for ranking the criticality of the elements in the electric network and for identifying the vulnerable regions and economic sectors that could be strengthened through preparedness planning.
Identification of Critical States in Power Systems by Limit State Surface Reconstruction
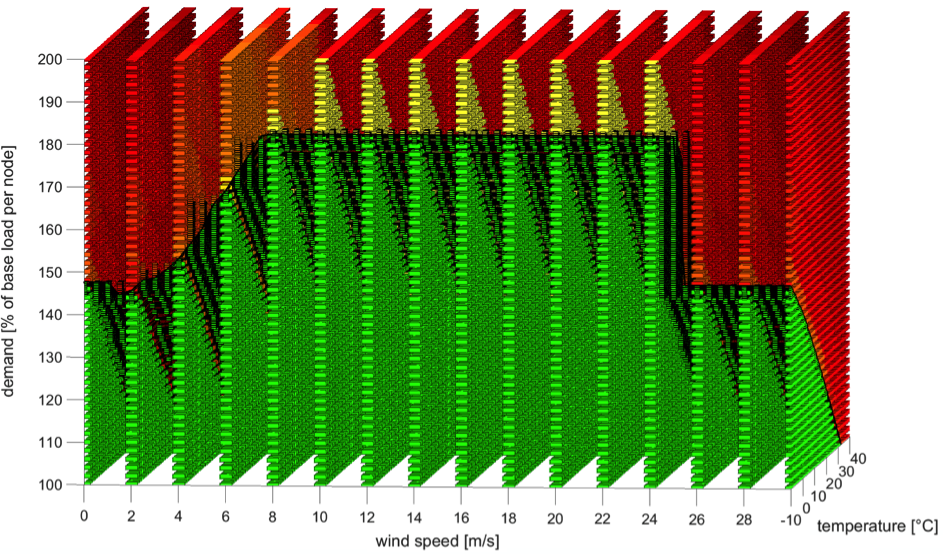
In this project, a novel method for the online indication of criticality in a power system is presented. The rapid expansion of renewable power generation puts an increasing stress on existing electricity grids due to the decentralized and fluctuating nature of renewable energy sources (RES) as opposed to conventional sources such as coal or gas. Given the associated higher risk of overloaded components as a result of unpredictable energy spikes and rerouted power flows through the transmission network, being able to determine the criticality associated with current and near future power system operating conditions all the more important. To this aim, a methodology is developed to identify critical states in electric power systems, for which the combination of different weather factors and customer demand impacts the capability of the infrastructure to transfer and supply the required amount of power. It is based on three main elements: 1) Reconstruction of the limit surface of an electrical infrastructure, i.e., the interface separating the set of input parameters leading to non-critical operation from the ones causing critical operating states that, e.g., require load shedding or other control actions by the transmission system operator (TSO) to prevent component or even system failure. Safe and critical regions of operations are thereby identified using a modified version of the DC-optimal-power-flow-based OPA model. 2) Determination of the position of an operating point w.r.t. the limit surface. 3) System trajectory forecast.
Consequently, the proposed criticality indicator allows the early detection of an imminent departure of a power system from sustainable operation by quantifying the proximity of current and near future operating points to adverse states of operation, whose boundaries in the phase space are given by the limit state surface. First tests show that our method not only correctly identifies the closeness of a system to detrimental states of operation in advance, but also distinguishes whether or not the system is actually approaching or moving away from such critical states.
Critical State Mitigation
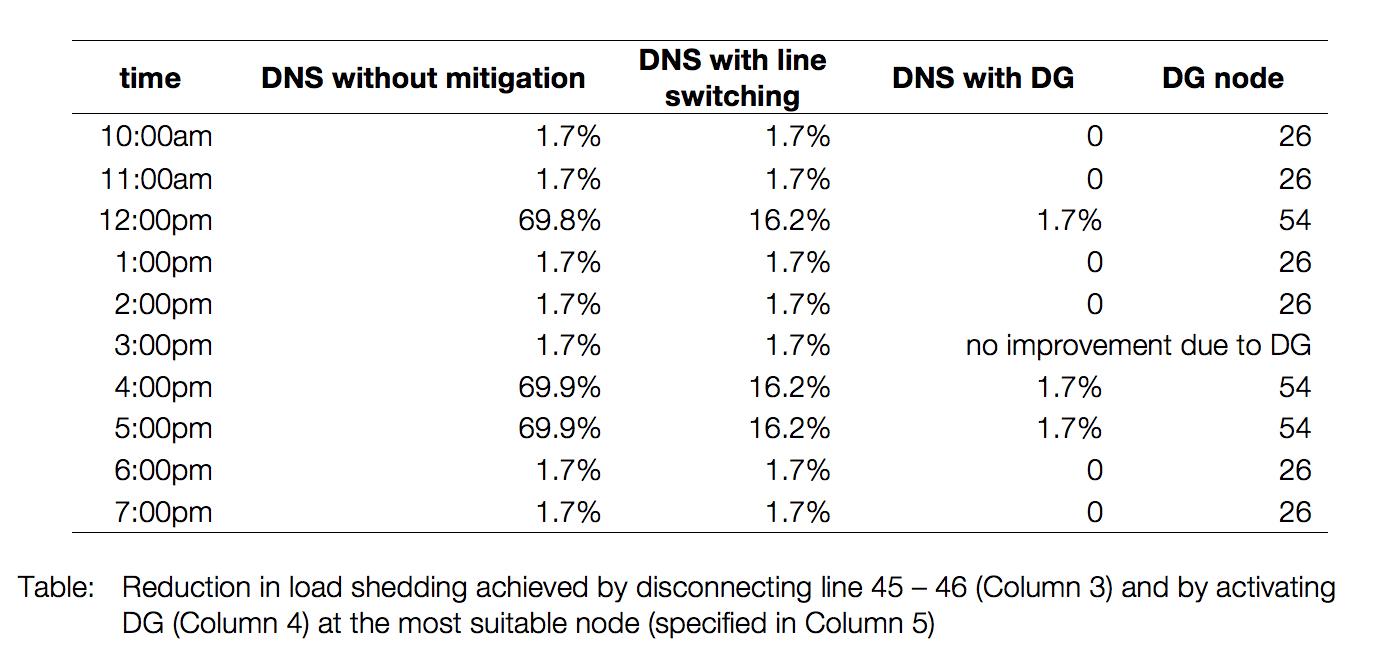
While identifying the onset of critical operating conditions in a power system is important, being able to mitigate or prevent potentially adverse states of operation is equally crucial. Several options are available to achieve this, e.g., transmission switching, where certain power lines are intentionally disconnected by the TSO with the objective of improving voltage profiles and increasing the overall power transfer capacity in certain situations; load reduction methods, which is carried out at the transmission grid level by intentionally shedding a portion of the total load; distributed generation (DG), where part of the demand is satisfied locally via alternative sources such as PV panels or small-scale waste-to-energy plants; or islanding, where unstable parts of the grid are isolated from the remaining transmission system in order to keep any local instability from spreading. Our assessment of mitigation strategies includes line switching and distributed generation, both of which are found to improve the system performance under critical conditions with varying degree in a 24-h trajectory analysis (see table). While DG is generally superior, both strategies have their merit due to the small costs associated with the implementation of line switching compared to the costs involved in setting up DG.